Introducing Aligned Reports

Starting in 2024 our compost, lagoon water, and manure reports have alignment marks on the soil nutrients section. (see below).

Suppose that i) you just purchased compost and had it tested by us; ii) the dairy nearby has a bunch of free manure they had tested and you plowed in 2 tons/acre last fall; and iii) you want to use a soil test from last fall instead of pulling a fresh soil sample.
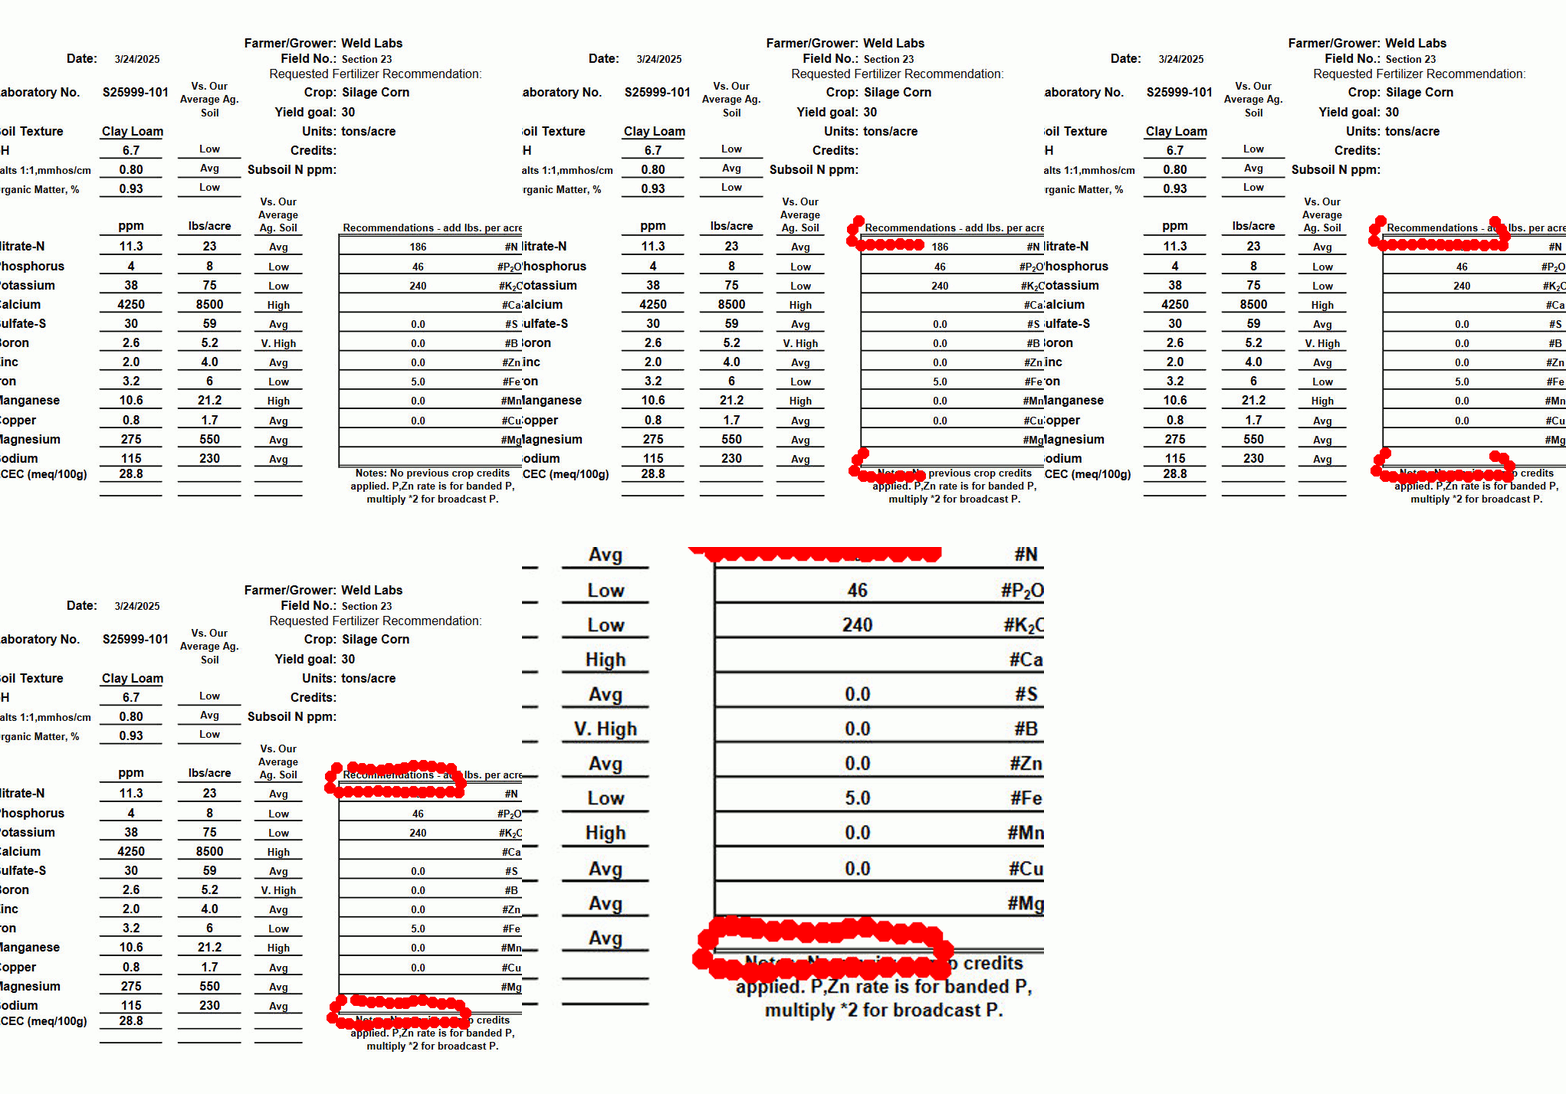
Your soil test reads 11.3 ppm NO3-N and you need to add 186 lbs N/acre to hit your 30 tons/acre yield goal for Corn Silage. We have estimated mineralization rates for both manure and compost on their respective reports. We lay the compost report on bottom, then align the manure report on top of it, and the soil report on top of that.
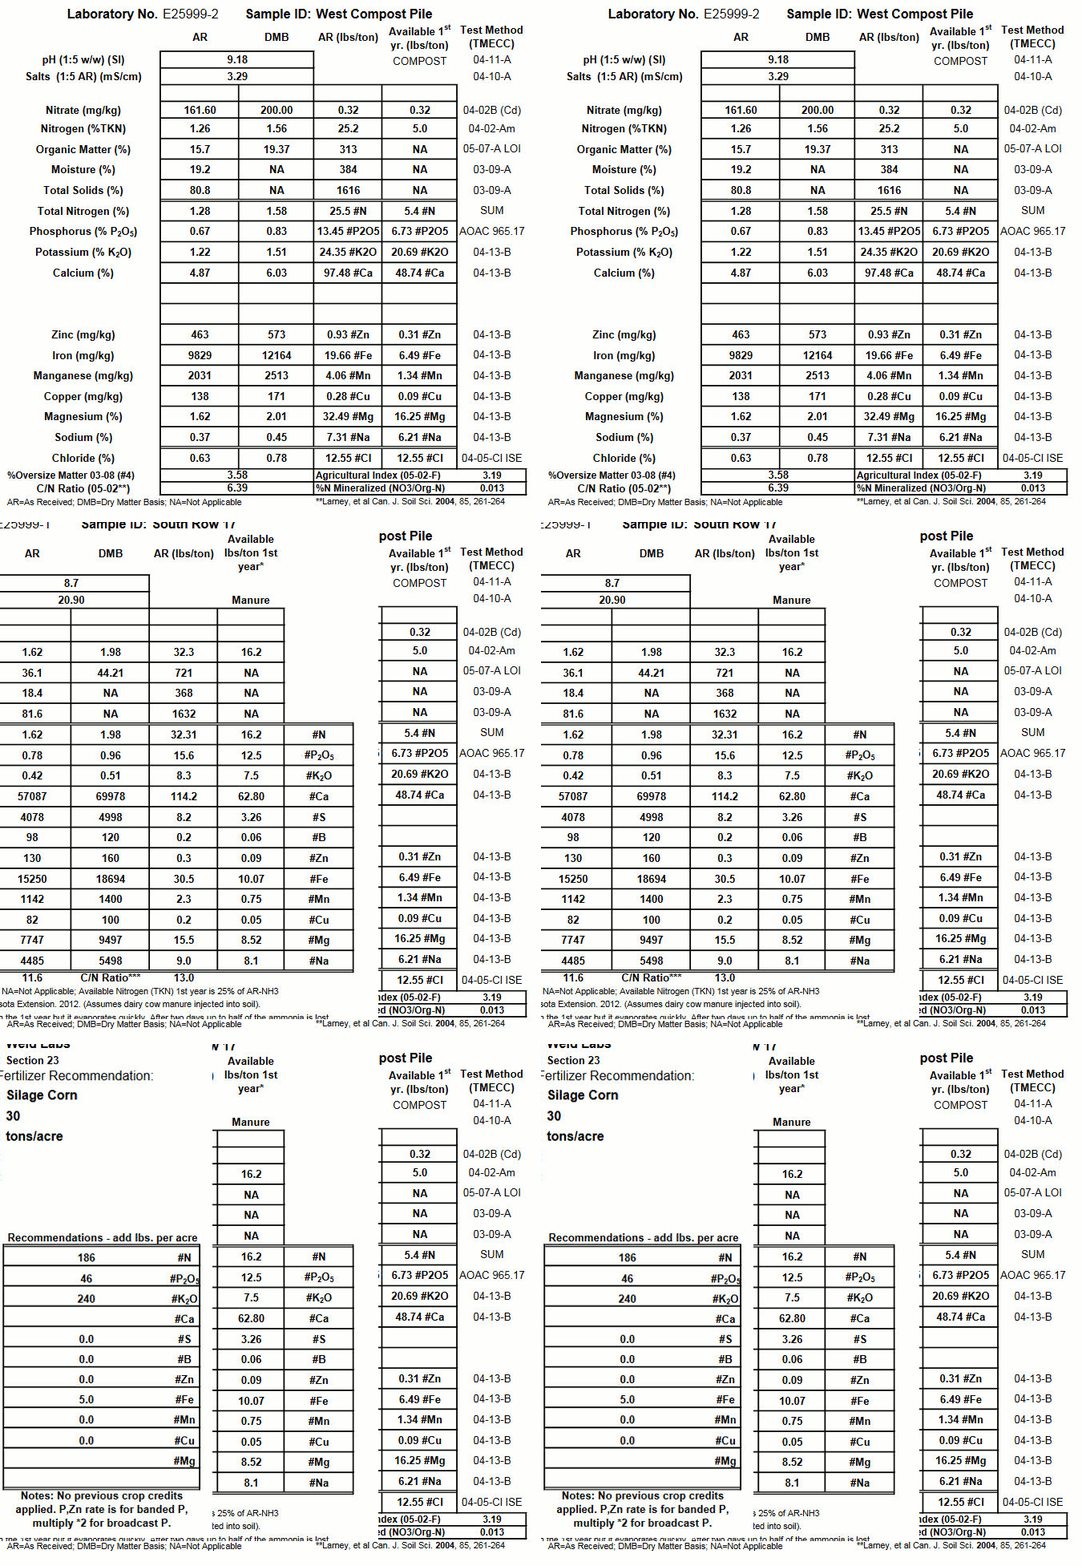
So we need 186 lbs N/acre, we plowed in two tons of manure/acre providing 16.2×2 = 32.4 lbs/acre, then we added 1 ton of compost/acre which provides 5.4 lbs nitrogen/acre. 186 -32.4 -5.4 = 148.2 lbs N/acre is required from the fertilizer company.

Similar calculations can be performed for P2O5, K2O, and the micronutrients. Sometimes it is important to factor in the sulfur and minerals in irrigation water. Luckily we have packages for that.

We are full-circle at Weld Labs. We test the irrigation water, the soil, the compost, and the fertilizer to get your crops growing. During growth we test the plant tissue to determine if there are nutrient deficiencies that might affect the harvest. Then we test the harvested crop to determine protein, fat, fiber, and ultimately market value.
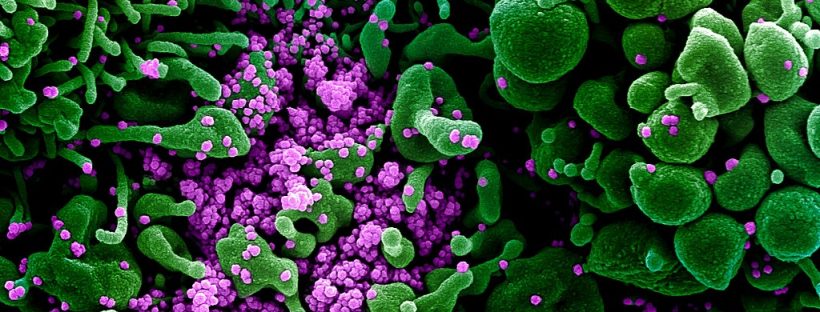

Coronavirus picture

Coronavirus (COVID-19) Update: We are open.

We provide critical agricultural and environmental testing services so we are still open. When you drop off samples we ask that you place them in a bin outside the front door instead of coming inside to limit person-to-person contact. If you have any questions we can help over the phone at 970-353-8118.

(Credit: NIAID. Image unmodified. https://www.flickr.com/photos/niaid/49666286236/ CC-BY-2.0 https://creativecommons.org/licenses/by/2.0/deed.en). Colorized scanning electron micrograph of an apoptotic cell (green) heavily infected with SARS-COV-2 virus particles (purple), isolated from a patient sample. Image captured and color-enhanced at the NIAID Integrated Research Facility (IRF) in Fort Detrick, Maryland.

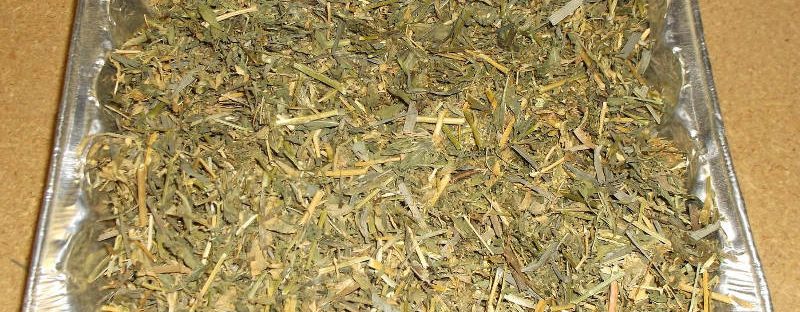
Alfalfa in Pan

Evaluating Alfalfa – A Blind Study of 39 Labs

We presented a poster at the California Alfalfa and Forage Symposium last November. The full paper is now available for download.

A method to prepare unground alfalfa samples with uniform composition indistinguishable from routine, cored alfalfa samples is reported. These samples were sent to fourty NFTA certified laboratories to determine the Relative Feed Value (RFV) by NIR and/or wet chemistry. The variation in ADF was much lower than NDF. In the paper we argue the merits of using blind samples and calculating RFV from ADF alone to circumvent this problem. At Weld Labs we perform NDF analyses using the reference method to minimize problems.